Sign In to Your Account
Subscribers have complete access to the archive.
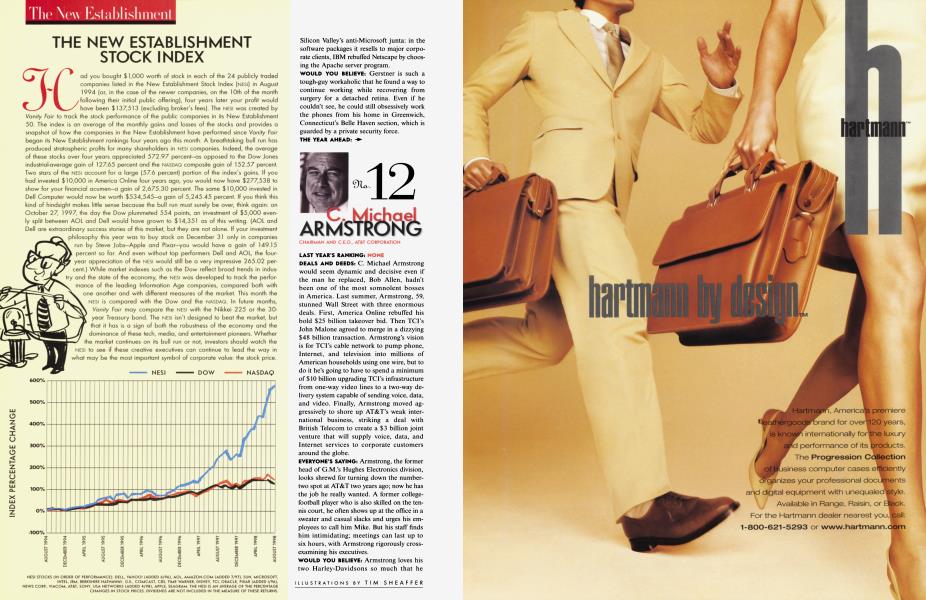
Sign In Not a Subscriber?Join NowHad you bought $ 1,000 worth of stock in each of the 24 publicly traded companies listed in the New Establishment Stock Index (NESl) in August 1994 (or, in the case of the newer companies, on the 10th of the month following their initial public offering), four years later your profit would have been $137,513 (excluding broker's fees). The NESI was created by Vanity Fair to track the stock performance of the public companies in its New Establishment 50. The index is an average of the monthly gains and losses of the stocks and provides a snapshot of how the companies in the New Establishment have performed since Vanity Fair began its New Establishment rankings four years ago this month. A breathtaking bull run has produced stratospheric profits for many shareholders in NESI companies. Indeed, the average of these stocks over four years appreciated 572.97 percent—as opposed to the Dow Jones industrial-average gain of 127.65 percent and the NASDAQ composite gain of 152.57 percent. Two stars of the NESI account for a large (57.6 percent) portion of the index's gains. If you had invested $10,000 in America Online four years ago, you would now have $277,538 to show for your financial acumen—a gain of 2,675.30 percent. The same $10,000 invested in Dell Computer would now be worth $534,545—a gain of 5,245.45 percent. If you think this kind of hindsight makes little sense because the bull run must surely be over, think again: on October 27, 1997, the day the Dow plummeted 554 points, an investment of $5,000 evenly split between AOL and Dell would have grown to $14,351 as of this writing. (AOL and Dell are extraordinary success stories of this market, but they are not alone. If your investment philosophy this year was to buy stock on December 31 only in companies run by Steve Jobs—Apple and Pixar—you would have a gain of 149.15 percent so far. And even without top performers Dell and AOL, the four-year appreciation of the NESI would still be a very impressive 265.02 percent.) While market indexes such as the Dow reflect broad trends in industry and the state of the economy, the NESI was developed to track the performance of the leading Information Age companies, compared both with one another and with different measures of the market. This month the NESI is compared with the Dow and the NASDAQ. In future months, Vanity Fair may compare the NESI with the Nikkei 225 or the 30year Treasury bond. The NESI isn't designed to beat the market, but that it has is a sign of both the robustness of the economy and the dominance of these tech, media, and entertainment pioneers. Whether the market continues on its bull run or not, investors should watch the NESI to see if these creative executives can continue to lead the way in what may be the most important symbol of corporate value: the stock price.
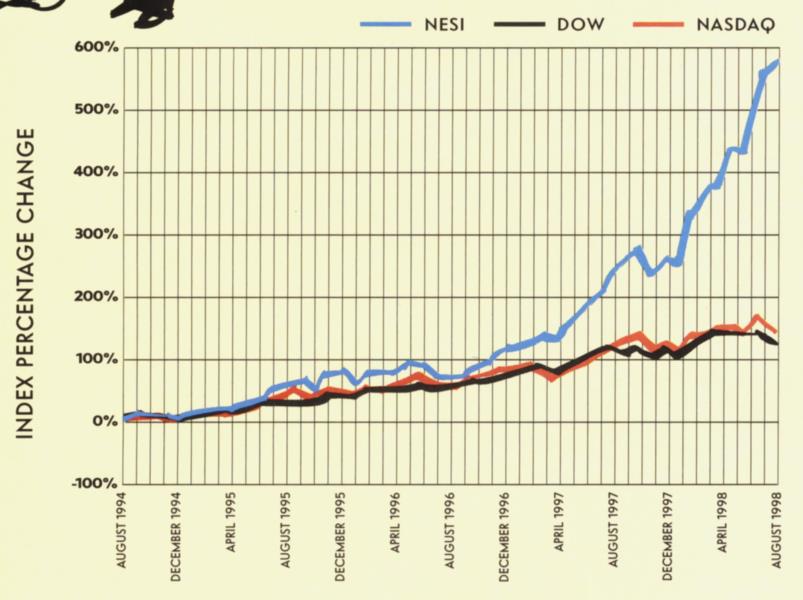
NESI STOCKS (IN ORDER OF PERFORMANCE): DELL. YAHOO! (ADDED 6/96), AOL, AMAZON.COM (ADDED 7/97), SUN, MICROSOFT, INTEL, IBM, BERKSHIRE HATHAWAY, G.E., COMCAST, CBS, TIME WARNER, DISNEY, TCI, ORACLE, PIXAR (ADDED 1/96), NEWS CORP., VIACOM, AT&T, SONY, USA NETWORKS (ADDED 4/98), APPLE, SEAGRAM. THE NESI IS AN AVERAGE OF THE PERCENTAGE CHANGES IN STOCK PRICES, DIVIDENDS ARE NOT INCLUDED IN THE MEASURE OF THESE RETURNS.


Subscribers have complete access to the archive.
Sign In Not a Subscriber?Join Now